You Choose: Potentially Get Paid to Wait or Get Punched in the Face

What makes MKAM ETF distinct is the proprietary algorithm it employs to obtain, we believe, a better measure of risk and return than the average market participant. We subscribe to the general advice that you want to be invested in stocks most of the time. However, historically, about 15% of the time, the stock market is both expensive and characterized by bad momentum. Avoiding this “red zone” allowed investors to generate most or all of S&P 500[1] returns, historically, while eliminating substantial drawdowns, defined as those significantly worse than-10%.

Since our ETF’s launch in April the market, and our algorithm, hasn’t changed much. Stocks remain too expensive and yet continue to rise. Consequently, we began our life as a public ETF with 50% exposure to the S&P 500 through low-cost ETF IVV. That exposure grew to 52% at the end of August, as the stock market, and MKAM, increased in value. But otherwise, the stock market has been boringly consistent. In stark contrast, all the action is in the bond market.

Fortunately, we can apply the same principles of our algorithm to the bond market. Our valuation discipline continues to favor short-term or low-duration[2] bonds. Our trend indicators continue to tell us to wait before we begin to add longer-term bonds to the portfolio, extending our duration.

At the end of 2021, just before the Federal Reserve finally began the first material and sustained rate hiking cycle since the Great Financial Crisis of 2008, 3-month US Treasury Bills yielded a paltry 0.1%. This prompted Bridgewater founder Ray Dalio to pronounce “cash is trash.”

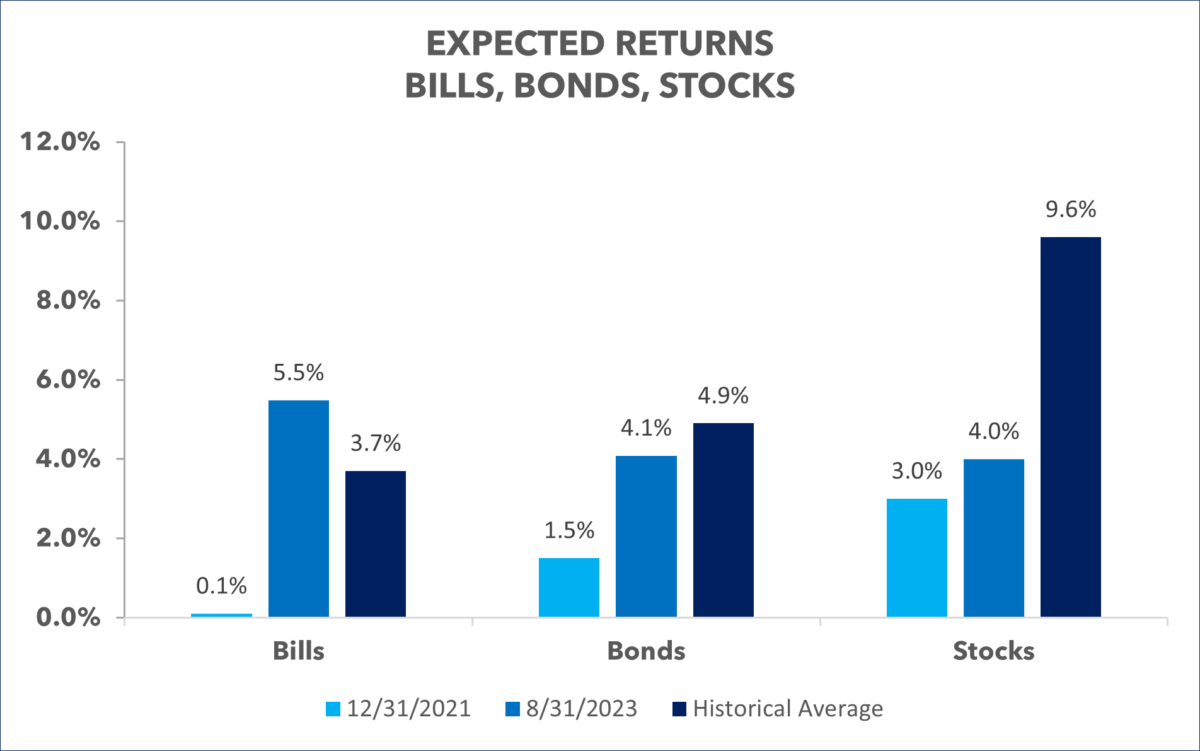
In less than two years, 3-month US Treasury yields rose considerably. As we write, they pay 5.5%. Especially for being the closest instrument to risk free in the market, 5.5% is a great return. Further, it is substantially above its historical average. Cash is, once again, king.

From real estate to the stock market, most assets today are still priced for the zero-interest rate world of 2009 through 2021. They offer substantially lower than normal returns. The lone exception is 3-month US Treasury bills. And MKAM ETF is flush with them.

10-Year US Treasuries are approaching their long-term average of 4.9%. They ended August at a yield of 4.1% and further spiked after the September 1st strong jobs report to 4.3%. Today, they sit only 60 basis points[3] below their long-term average.

While those rates are approaching normal levels, they’re still abnormal in that the yield curve is inverted: short-term rates are above long-term rates. This defies the very concept of the time value of money.
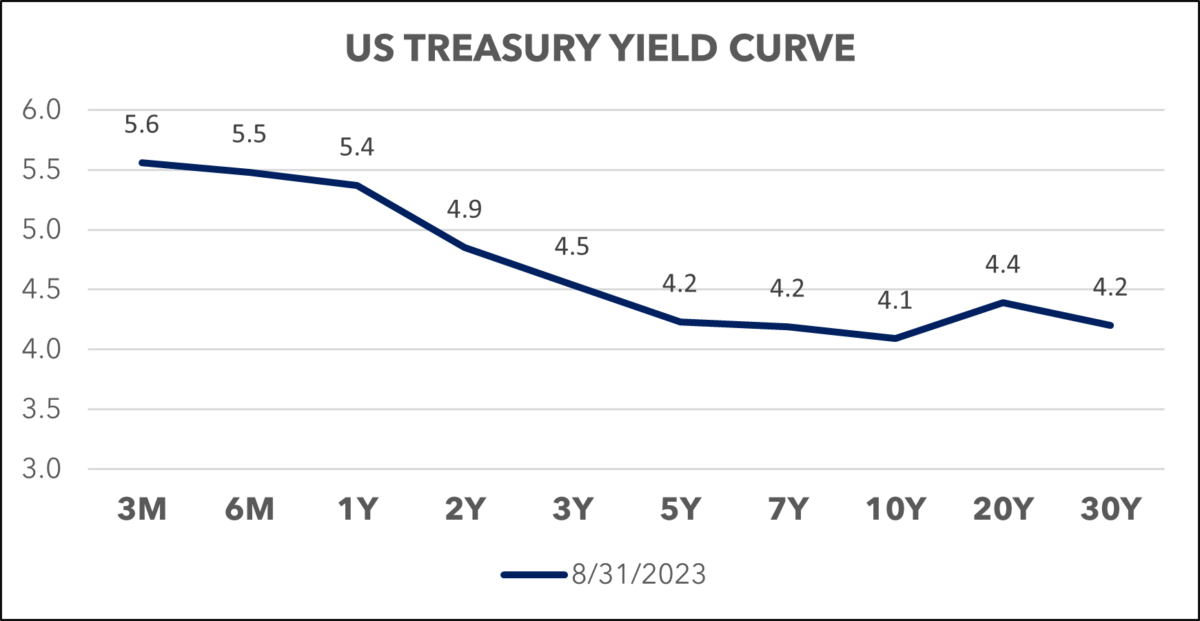

Source: US Treasur

To quote the Federal Reserve[4]: “an inverted yield curve (short rates above long rates) indicates a recession in about a year, and yield curve inversions have preceded each of the last eight recessions (as defined by the NBER[5]). One of the recessions predicted by the yield curve was the most recent one: The yield curve inverted in May 2019, almost a year before the most recent recession started in March 2020.”

There have been two notable false recession forecasts from inverted yield curves in the past: 1966 and 1998.[5] The hope of the Federal Reserve today is to add a third false positive to the list. The goal of Federal Reserve Chair Jay Powell is to engineer a “soft landing,” whereby the economy cools enough to bring inflation under control but avoid causing the economy to enter a recession.

Current market consensus implies that the Fed will be successful. In this scenario, short-term interest rates would soon fall. The current Fed “dot plot” forecasts a Federal Funds rate of 2.5% to 2.75% as inflation falls to the Fed’s 2% target. If this is accomplished, using the historical positive spread to 10-year yields, the current 4.1% 10-year yield makes total sense.

There is a cogent argument, however, to be made that short-term rates will remain higher than the market expects and thus, long-term rates will continue to surprise to the upside. After 15 years we have been conditioned to believe interest rates should be lower than they were historically. But they were only brought so low to rescue the economy after the Great Financial Crisis. Further, post Covid, again a time of extreme fear, the 10-year yield hit its lowest level of 0.54%. Absent a once a hundred-year financial crisis and a once a hundred-year pandemic, why should we expect rates to be so low?

A Fed Funds Rate of 3.5% and a 10-year US Treasury yield of 5% and a 30-year mortgage rate of 6% would all be exactly in line with historical averages. And, from a fundamental level, they all make sense with a healthy economy.

Whether the Fed and current market consensus is correct, or contrarian points of view as typified by “bond king” Bill Gross and Calculated Risk author Bill McBride prove correct, the good news is we can rely on the other half of our algorithm: trend.

Since the end of 2021, ETF IEF, consisting of 7-to-10-year US Treasuries, is down -15%. With current US Treasury yields, IEF owners from the end of 2021 will have to wait 4 years before they recover and break even. In year 5 they would finally start to earn some net income.

On the other hand, a simple trend following strategy, similar, but shorter, than we use for the equity portion of our algorithm, would be down -1.25%, over the same time frame. This investor, given current yields, will be back in the black in a few months.


Source: MKAM ETF and FastTrack. Red line = IEF total return, green and red line = IEF with Fast Track trend following signal, invested in IEF when trend signal is positive and money market rather than IEF, when trend signal is negative.

As yields continue their rising trend, and long duration bonds continue to fall, our trend indicator remains negative. In finance there is an adage to avoid “catching a falling knife.” Investors that have been jumping in to try and capture rising yields in long bonds have been doing exactly that and it has been very painful!

When bond trends turn positive our investors can expect that we will begin to extend our duration. Investing when returns are promising, and risk is low is a rewarding endeavor. The short-term bond market easily clears the hurdle. To find out when the long bond market does as well, stay tuned.

[1]Standard and Poor’s 500 (S&P 500) is an index of the 500 largest U.S. public companies. It measures companies’ size by their market capitalization.

[2]Duration is a measure of the sensitivity of the price (the value of principal) of a fixed-income investment to a change in interest rates. It is expressed as a number of years. Rising interest rates mean falling bond prices, while declining interest rates mean rising bond prices.

[3]Basis Point is a unit of measure used in quoting yields, changes in yields or differences between yields. One basis point is equal to 0.01%, or one one-hundredth of a percent of yield and 100 basis points equals 1%.

[4]“Yield Curve and Predicted GDP Growth,” Federal Reserve Bank of Cleveland, 2023

[5] National Bureau of Economic Research

[6] A recession did eventually occur between March and November 2001.

Keep Me Informed

Please enter your email address to be notified of new content, including market commentary and special updates.

Thank you for your interest in the MKAM Funds.

100% Spam-free. No list sharing. No solicitations. Opt-out anytime with one click.

Untitled

Important Information

The Fund’s investment objectives, risks, charges and expenses must be considered carefully before investing. This and other important information is contained in the prospectus, which may be obtained by following the links Prospectus and Summary Prospectus or by calling   +1.929.224.2706. Please read the prospectus carefully before investing.

Investments involve risk. Principal loss is possible.

The Fund is actively-managed and is subject to the risk that the strategy may not produce the intended results. The Fund is new and has a limited operating history to evaluate.

Risk of Investing in Other ETFs. Because the Fund may invest in other ETFs, the Fund’s investment performance is impacted by the investment performance of the selected underlying ETFs. An investment in the Fund is subject to the risks associated with the ETFs that then-currently comprise the Fund’s portfolio. At times, certain of the segments of the market represented by the Fund’s underlying ETFs may be out of favor and underperform other segments. The Fund will indirectly pay a proportional share of the expenses of the underlying ETFs in which it invests (including operating expenses and management fees), which are identified in the fee schedule above as “Acquired Fund Fees and Expenses.”

Options Risk.
Selling or Writing Options Risk. Writing option contracts can result in losses that exceed the seller’s initial investment and may lead to additional turnover and higher tax liability. The risk involved in writing a call option is that there could be an increase in the market value of the reference asset. A reference asset may be an index or ETF. If this occurs, the call option could be exercised and the reference asset would then be sold at a lower price than its current market value. In the case of cash settled call options, the call seller would be required to purchase the call option at a price that is higher than the original sales price for such call option. Similarly, while writing call options can reduce the risk of owning the reference asset, such a strategy limits the opportunity to profit from an increase in the market value of the reference asset in exchange for up-front cash at the time of selling the call option. The risk involved in writing a put option is that there could be a decrease in the market value of the reference asset. If this occurs, the put option could be exercised and the reference asset would then be sold at a higher price than its current market value. In the case of cash settled put options, the put seller would be required to purchase the put option at a price that is higher than the original sales price for such put option.
Buying or Purchasing Options Risk. If a call or put option is not sold when it has remaining value and if the market price of the reference asset, in the case of a call option, remains less than or equal to the exercise price, or, in the case of a put option, remains equal to or greater than the exercise price, the buyer will lose its entire investment in the call or put option. Since many factors influence the value of an option, including the price of the reference asset, the exercise price, the time to expiration, the interest rate, and the dividend rate of the reference asset, the buyer’s success in implementing an option buying strategy may depend on an ability to predict movements in the prices of individual assets, fluctuations in markets, and movements in interest rates. There is no assurance that a liquid market will exist when the buyer seeks to close out any option position. When an option is purchased to hedge against price movements in an reference asset, the price of the option may move more or less than the price of the reference asset.
Box Spread Risk. A Box Spread is the combination of a synthetic long position coupled with an offsetting synthetic short position through a combination of options contracts on a reference asset such as index, equity security or ETF with the same expiration date. A Box Spread typically consists of (4) four option positions two of which represent the synthetic long and two representing the synthetic short. If one or more of these individual option positions are modified or closed separately prior to the option contract’s expiration, then the Box Spread may no longer effectively eliminate risk tied to reference asset’s movement. Furthermore, the Box Spread’s value is derived in the market and is in part, based on the time until the options comprising the Box Spread expire and the prevailing market interest rates. If the Fund sells a Box Spread prior to its expiration, then the Fund may incur a loss. The Fund’s ability to profit from Box Spreads is dependent on the availability and willingness of other market participants to sell Box Spreads to the Fund at competitive prices.
FLEX Options Risk. FLEX Options are exchange-traded options contracts with uniquely customizable terms like exercise price, style, and expiration date. Due to their customization and potentially unique terms, FLEX Options may be less liquid than other securities, such as standard exchange listed options. In less liquid markets for FLEX Options, the Fund may have difficulty closing out certain FLEX Option positions at desired times and prices. The value of FLEX Options will be affected by, among others, changes in the reference asset price, changes in actual and implied interest rates, changes in the actual and implied volatility of the reference asset and the remaining time until the FLEX Options expire. The value of the FLEX Options will be determined based upon market quotations or using other recognized pricing methods. During periods of reduced market liquidity or in the absence of readily available market quotations for the holdings of the Fund, the ability of the Fund to value the FLEX Options becomes more difficult and the judgment of the

Large-Capitalization Companies Risk. Large-capitalization companies may trail the returns of the overall stock market. Large-capitalization stocks tend to go through cycles of doing better – or worse – than the stock market in general.

Derivatives Risk. A derivative is any financial instrument whose value is based on, and determined by, another asset, rate or index (e.g., stock options). Unfavorable changes in the value of the reference asset, rate or index may cause sudden losses.

Counterparty Risk. Counterparty risk is the risk that a counterparty to a financial instrument held by the Fund or by a special purpose or structured vehicle invested in by the Fund may become insolvent or otherwise fail to perform its obligations, and the Fund may obtain no or limited recovery of its investment, and any recovery may be significantly delayed. Exchange listed options, including FLEX Options, are issued and guaranteed for settlement by the Options Clearing Corporation (“OCC”). The Fund’s investments are at risk that the OCC will be unable or unwilling to perform its obligations under the option contract terms. In the unlikely event that the OCC becomes insolvent or is otherwise unable to meet its settlement obligations, the Fund could suffer significant losses.

Leverage Risk. Leverage risk refers to the potential for increased volatility and losses in a portfolio due to the use of derivatives or other financial instruments that may magnify gains and losses beyond the initial investment. The Fund will utilize derivatives, such as options, to gain exposure to certain assets or markets with a smaller initial investment.

New Fund Risk. The Fund is a recently organized investment company with no operating history. As a result, prospective investors have no track record or history on which to base their investment decision. There can be no assurance that the Fund will grow to or maintain an economically viable size.

ETFs may trade at a premium or discount to their net asset value. ETF shares may only be redeemed at NAV by authorized participants in large creation units. There can be no guarantee that an active trading market for shares will exist. The trading of shares may incur brokerage.

This material has been distributed for informational purposes only and should not be considered as investment advice or a recommendation of any particular security, strategy or investment product. We make no representation or warranty as to the accuracy or completeness of the information contained herein including third-party data sources. The views expressed are as of the publication date and subject to change at any time. No part of this material may be reproduced in any form, or referred to in any other publication without express written permission. References to other funds should not to be interpreted as an offer or recommendation of these securities.

The Fund is distributed by Quasar Distributors, LLC. The fund’s investment advisor is Empowered Funds, LLC, which is doing business as ETF Architect.

© Copyright 2012 – 2025 | Home | Advisor Home | Privacy Policy | Contact Us |  All Rights Reserved